CAGR Calculator: Formula, Examples and Returns Explained
Calculate compound annual growth rate using beginning value, ending value and time. Learn the CAGR formula, examples, limitations and Excel methods.
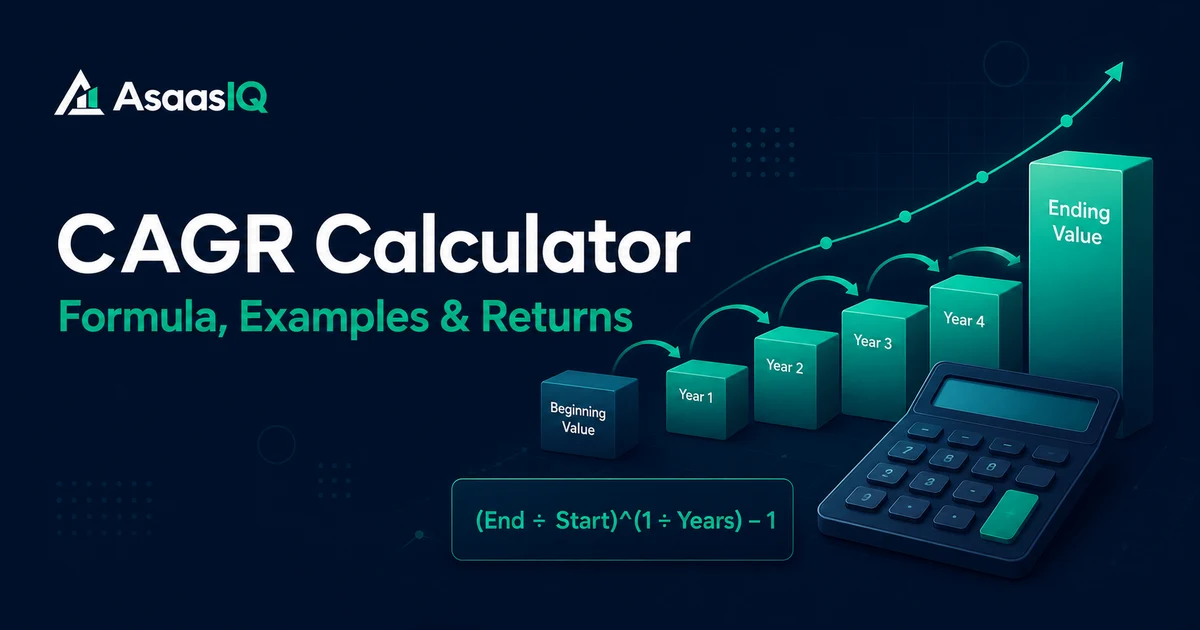
An investment rises from 10,000 to 16,000 over four years. Its total gain is 60%, but that does not mean it earned 15% every year. Compounding makes the correct annualised figure approximately 12.47%.
That smoothed annual rate is the compound annual growth rate, or CAGR.
CAGR formula:
CAGR = (Ending value ÷ Beginning value)^(1 ÷ Years) − 1
CAGR is useful for comparing investments, revenue, users, property values and other quantities over unequal time spans. But it is not the return an investor literally received each year, and it can hide volatility, fees, cash flows and losses along the way.
CAGR calculator
Enter three values into the CAGR Calculator:
- Beginning value.
- Ending value.
- Number of years.
The result shows total growth and CAGR as a percentage, so you can check your own numbers against every worked example below.
Quick example
Beginning value: 10,000
Ending value:    16,000
Years:           4

CAGR = (16,000 ÷ 10,000)^(1 ÷ 4) − 1
     = 1.6^0.25 − 1
     = 0.1247
     = 12.47%
Check the answer by compounding 10,000 at 12.47% for four years:
10,000 × (1 + 0.1247)^4 ≈ 16,000
The formula is currency-neutral. The same calculation works with dollars, pounds, euros, rupees or any other consistent unit.
What does CAGR mean?
CAGR is the single annual rate that would turn the beginning value into the ending value if growth occurred smoothly and compounded once per year.
It answers:
What constant annual compound rate connects these two values over this period?
It does not answer:
What happened in each individual year?
Consider two portfolios:
| Year-end | Portfolio A | Portfolio B |
|---|---|---|
| Start | 10,000 | 10,000 |
| Year 1 | 11,247 | 7,000 |
| Year 2 | 12,649 | 14,000 |
| Year 3 | 14,226 | 12,000 |
| Year 4 | 16,000 | 16,000 |
Both have the same beginning value, ending value and four-year CAGR. Portfolio B took a much rougher path. CAGR erases that path and reports only the smooth rate linking the endpoints.
That smoothing is both its strength and its main limitation.
CAGR formula explained
The formula is:
CAGR = (EV ÷ BV)^(1 ÷ n) − 1
Where:
EVis ending value.BVis beginning value.nis the number of years.
Multiply the decimal result by 100 to express it as a percentage.
Why the exponent is 1 divided by years
Compound growth works like this:
Ending value = Beginning value × (1 + rate)^years
Rearranging to solve for the rate:
Ending value ÷ Beginning value = (1 + rate)^years

(Ending value ÷ Beginning value)^(1 ÷ years) = 1 + rate

rate = (Ending value ÷ Beginning value)^(1 ÷ years) − 1
The root reverses the effect of repeatedly compounding the rate.
How to calculate CAGR step by step
Suppose a portfolio grows from 25,000 to 41,000 over 5.5 years.
Step 1: divide ending value by beginning value
41,000 ÷ 25,000 = 1.64
Step 2: divide one by the number of years
1 ÷ 5.5 = 0.181818
Step 3: raise the growth multiple to that power
1.64^0.181818 ≈ 1.0941
Step 4: subtract one
1.0941 − 1 = 0.0941
Step 5: convert to a percentage
CAGR ≈ 9.41%
Decimal years are valid when the dates do not land exactly on an anniversary. A good calculator should calculate the time precisely from dates rather than asking users to round 5 years and 7 months to either 5 or 6.
CAGR with months or exact dates
If a period is provided in months:
Years = Months ÷ 12
For 30 months:
Years = 30 ÷ 12 = 2.5
Then use 2.5 in the normal CAGR formula.
For exact dates, a calculator can use:
Years = days between dates ÷ 365.2425
The selected convention should be disclosed. Financial products may use their own day-count rules, so a general CAGR calculator should not pretend to reproduce every contractual yield convention.
CAGR examples
Investment example
An investment moves from $8,000 to $12,500 in six years:
CAGR = (12,500 ÷ 8,000)^(1 ÷ 6) − 1
     ≈ 7.72%
Business revenue example
Annual revenue rises from €2 million to €3.5 million over four years:
CAGR = (3.5 ÷ 2)^(1 ÷ 4) − 1
     ≈ 15.02%
Because both values use millions of euros, entering 2 and 3.5 gives the same CAGR as entering 2,000,000 and 3,500,000.
Declining value example
A property falls from £400,000 to £340,000 over three years:
CAGR = (340,000 ÷ 400,000)^(1 ÷ 3) − 1
     ≈ −5.27%
CAGR can be negative when the ending value is below a positive beginning value.
Doubling example
An index doubles over ten years:
CAGR = (2 ÷ 1)^(1 ÷ 10) − 1
     ≈ 7.18%
This is why a 100% total gain over ten years is not a 10% CAGR.
Total return versus CAGR
Total return ignores the time required to produce the gain:
Total return = (Ending value ÷ Beginning value) − 1
If 10,000 becomes 15,000:
Total return = 50%
But the CAGR depends on time:
| Time taken | CAGR |
|---|---|
| 2 years | 22.47% |
| 5 years | 8.45% |
| 10 years | 4.14% |
The total gain is identical in all three cases. CAGR shows the enormous difference created by time.
CAGR versus average annual return
A simple arithmetic average adds annual returns and divides by the number of years. CAGR reflects compounding.
Suppose an investment gains 50% in year one and loses 40% in year two:
Arithmetic average = (50% − 40%) ÷ 2 = 5%
But 10,000 follows this path:
After year 1: 10,000 × 1.50 = 15,000
After year 2: 15,000 × 0.60 = 9,000
The investor lost 10% overall. CAGR is:
CAGR = (9,000 ÷ 10,000)^(1 ÷ 2) − 1
     ≈ −5.13%
The arithmetic average is not wrong; it answers a different question. It does not describe compounded wealth growth.
CAGR versus annualised return
People often use the terms interchangeably, but "annualised return" can refer to several methods:
- CAGR from beginning and ending values.
- Geometric mean of periodic returns.
- Time-weighted return for a portfolio with cash flows.
- Money-weighted return or internal rate of return.
- A short-period return scaled to one year under a product convention.
Before comparing two annualised figures, read the methodology. A fund's published annualised performance may include reinvested distributions and specific valuation dates, while a home-built CAGR based only on price can exclude dividends.
CAGR versus IRR and XIRR
CAGR works best when there is one beginning value and one ending value with no intermediate additions or withdrawals.
If money moves in or out during the period, CAGR can become misleading.
Suppose an account starts at 10,000, receives another 20,000 near the end and finishes at 31,000. A naïve CAGR treats the entire ending value as growth from the original 10,000. That is clearly wrong.
Use:
- IRR when cash flows occur at regular intervals.
- XIRR when cash flows occur on actual irregular dates.
- Time-weighted return when measuring manager performance while removing the effect of investor-controlled cash flows.
CAGR is an endpoint tool, not a substitute for cash-flow-aware return calculation — if you're investing through regular contributions rather than a single lump sum, Lump Sum vs Monthly Investing covers the comparison CAGR alone can't answer.
How dividends, interest and distributions affect CAGR
A price-only CAGR excludes cash paid out unless it is included in the ending value.
For an investment that distributes dividends, use a total-return value that assumes distributions are reinvested if you want total-return CAGR. Otherwise, you may understate performance — see How Dividends Affect Your Total Investment Return for why that gap matters, and the Dividend Income Calculator to model reinvestment separately.
Be explicit:
- Price CAGR: based only on beginning and ending prices.
- Total-return CAGR: includes reinvested dividends or distributions.
- Investor CAGR: reflects the investor's actual cash flows, which may require XIRR rather than CAGR.
Do not add dividends to an ending value that already comes from a total-return index; that would count them twice.
Nominal CAGR versus real CAGR
Nominal CAGR does not account for inflation. To convert a nominal annual growth rate into an inflation-adjusted or real rate:
Real CAGR = ((1 + nominal CAGR) ÷ (1 + inflation rate)) − 1
If nominal CAGR is 8% and inflation averages 3%:
Real CAGR = (1.08 ÷ 1.03) − 1
          ≈ 4.85%
Simply subtracting 3% from 8% gives 5%, which is a close approximation at modest rates but not the exact compounded result.
Use the inflation rate that matches the country and spending currency relevant to the goal.
Currency-adjusted CAGR
International investors can receive a strong local-market CAGR and a weak home-currency result.
To calculate home-currency CAGR:
- Convert the beginning value using the beginning exchange rate.
- Convert the ending value using the ending exchange rate.
- Apply the CAGR formula to those home-currency values.
Do not calculate local CAGR and then casually subtract currency depreciation. Compounding and exchange-rate direction require consistent values.
CAGR after fees and taxes
Gross performance is not investor performance. For a net CAGR:
- Start with the actual amount invested, including entry costs.
- End with the actual redeemable value after ongoing fees.
- Include exit costs where relevant.
- Treat taxes consistently; realised and unrealised taxes can require different assumptions.
If a fund's NAV already deducts management expenses, do not deduct the expense ratio again from its historical NAV CAGR — see Understanding Mutual Fund Fees and Expense Ratios for how that already-deducted cost is reflected.
How to calculate CAGR in Excel and Google Sheets
Assume:
- Beginning value in cell
B2. - Ending value in cell
B3. - Years in cell
B4.
Use:
=(B3/B2)^(1/B4)-1
Format the result as a percentage.
In Excel, RRI can produce the equivalent periodic rate:
=RRI(B4,B2,B3)
For dated cash flows, use XIRR instead:
=XIRR(values_range, dates_range)
The initial investment normally appears as a negative cash flow and proceeds as positive cash flows. Incorrect signs are a common spreadsheet error.
When CAGR is useful
CAGR works well for:
- Comparing investments over the same or different multi-year periods.
- Measuring revenue, profit, users or market growth.
- Summarising property-value growth.
- Converting an endpoint result into an annualised rate.
- Checking whether a projected target requires an unrealistic growth rate.
- Comparing a portfolio with an appropriate benchmark.
It is especially useful as a compact summary—not as a complete risk report.
When CAGR is misleading
It hides volatility
Two paths with the same endpoints receive the same CAGR.
It depends heavily on dates
A peak ending date can make performance look exceptional; a market trough can make it look terrible.
It ignores intermediate cash flows
Contributions and withdrawals require IRR/XIRR or time-weighted methods.
It can omit income
Price data without reinvested distributions understates total return.
It can hide drawdowns
A portfolio may have lost 50% temporarily and still report a respectable long-term CAGR.
It is not a forecast
Historical CAGR is not a promised future rate. Projecting it forward assumes a smooth continuation that markets rarely provide — a caution worth keeping in mind if you're working out how much you need to retire from a historical growth assumption.
It becomes undefined in some cases
The normal formula requires a positive beginning value and a mathematically valid ratio. A beginning value of zero causes division by zero. Negative beginning or ending values can produce undefined or non-real results for ordinary CAGR. Use a different analysis for businesses moving from losses to profits.
What is a good CAGR?
There is no universal "good" CAGR. It depends on:
- Asset class.
- Risk and drawdowns.
- Inflation.
- Fees and taxes.
- Currency.
- Time period.
- Benchmark.
- Whether dividends are included.
A 7% real return with severe volatility is not automatically better for a near-term goal than a lower stable return. A company's revenue CAGR can look impressive while profit and cash flow deteriorate.
Compare like with like and pair CAGR with risk measures.
Where a CAGR calculator could go next
The CAGR Calculator covers the core case: beginning value, ending value, years, result. A more complete tool would also handle:
- Exact start/end dates instead of round years.
- Reverse modes: solve for ending value, starting value or time.
- Optional inflation adjustment and fees.
- A toggle that redirects to XIRR when contributions or withdrawals occur during the period, instead of silently miscalculating CAGR.
Until a calculator offers those directly, the formulas above let you adjust the inputs by hand before entering the clean beginning and ending values.
Frequently asked questions
What is CAGR in simple terms?
CAGR is the constant annual compound rate that connects a beginning value to an ending value over a specified number of years.
Is CAGR the same as total return?
No. Total return shows the entire percentage change. CAGR converts that change into an annual compound rate using the time period.
Can CAGR be negative?
Yes, when a positive beginning value falls to a smaller positive ending value.
Does CAGR include dividends?
Only if the ending value or return series includes reinvested dividends. Price-only CAGR does not.
Can I use months instead of years?
Yes. Divide months by 12 and use the resulting decimal years, or calculate from exact dates.
Why is CAGR different from average return?
An arithmetic average ignores the sequence and compounding of gains and losses. CAGR reflects the geometric rate linking actual endpoints.
Should I use CAGR or XIRR for monthly investments?
Use XIRR or another cash-flow-aware method when contributions or withdrawals occur on different dates.
Is a higher CAGR always better?
No. It can come with greater volatility, drawdowns, leverage, fees, taxes or currency risk. Compare risk and net returns as well.
Bottom line
CAGR turns a beginning value, ending value and time period into one comparable annual compound rate. It is excellent for summarising growth and terrible at showing the journey.
Use it when there are no meaningful intermediate cash flows. Include dividends, fees, inflation and currency consistently. Then pair the result with volatility, drawdown and a relevant benchmark before making a decision.
Sources & References
Educational information only
AsaasIQ provides general educational content about investing in Pakistan. Nothing on this site is personalized financial, tax, legal or investment advice. AsaasIQ is not a financial advisor, broker, asset management company or affiliate of the Pakistan Stock Exchange. Always verify current facts, rates and regulations with official sources before acting.

Founder and Editor, AsaasIQ
Software engineer and the founder of AsaasIQ. Not a licensed financial adviser -- every article is educational and source-linked.
Published August 2026 · Last reviewed August 2026